| Previous: Tutorial: Creating a Unit that Subscribes to Data | Next: Tutorial: Using Parameters and Properties |
|---|
Prerequisites
This tutorial assumes that you have completed one of the previous tutorials (Tutorial: Creating a Unit that Subscribes to Data, Tutorial: Creating a Unit that Publishes Data) where you have created the domains/Tutorials/etc/Tutorials.xml configuration file.
Otherwise, you can use another configuration file that comes with some MIRA examples, e.g.
or with configured mirabash:
Before this example file can be used it must be compiled. For this purpose the following command must be executed in the MIRA root folder:
Introduction
In the previous tutorials, we used the mira command line tool to launch a configuration file with Units. However, to simplify debugging and testing of Units, MIRA provides miracenter, a more sophisticated tool. miracenter allows you to:
- visualize the data in channels in 3D and 2D views or in textual form
- monitor the state and health status of units
- control the units by tuning their parameters (properties)
- invoke remote procedure calls (RPC)
and much more. The miracenter is designed to provide you with all tools you need during the development of new Units and applications.
Starting miracenter
Similar to the mira tool, you can start miracenter by optionally specifying a configuration file that shall be loaded:
Like mira, this starts a new MIRA process, loads the specified configuration files and instantiates and starts the contained Units. Additionally, it starts the GUI components and will show you the following user interface:
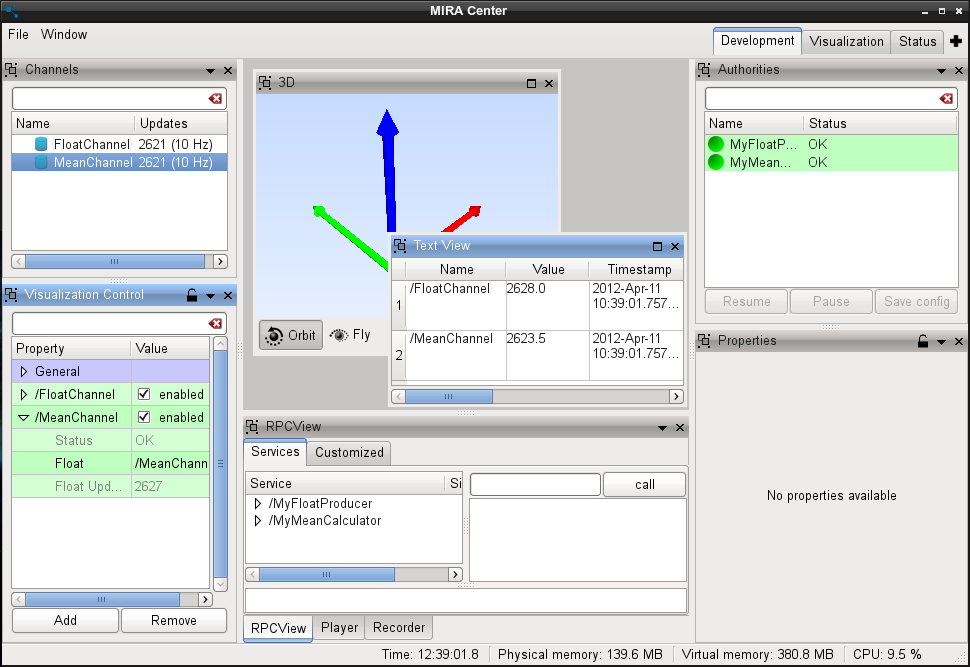
A short Overview
On the left side of the window you can see the "Channel View" which should contain "FloatChannel" and "MeanChannel", the channels that are published by our "FloatProducer" and "MeanCalculator" units. Next to the names, you should also see an increasing number that indicates that the channels are constantly updated with a frequency of 10 Hz.
Next to the Channel View, you will see a window with light blue background. This is the "3D View" that is used to visualize data in a 3D world. However, since our two channels contain scalar floating point values, they cannot be displayed in the 3D view. To visualize that data, we need a text view.
Adding a Text View
By choosing Window->Show View you can open new windows, tools and editors that can be arranged freely within the user interface. Let's add a "Text View" now. Your miracenter should now look as in the above image. The "Text View" can be used to display all data in channels as text. We can take a look at the data in "FloatChannel" now by dragging the channel from the "Channel View" and dropping it into the "Text View". We can do the same with "MeanChannel.
Using these views, the miracenter allows us to look into all the data that is exchanged between the units and we do not longer need to use "cout" console outputs for this purpose.
| Next: Tutorial: Using Parameters and Properties |
|---|